The gold standard for challenging protein stability analysis

Prometheus nanoDSF delivers simultaneous, multi-parameter characterization of protein and biologics stability, folding, unfolding, aggregation, and binding. Paint the full stability profile on the nano-scale: Unmatched low sample consumption and throughput.
All parameters that can be measured with Prometheus nanoDSF are listed below:
nanoDSF
THERMAL UNFOLDING
Tm (for 330 nm, 350 nm, and ratio)
Melting temperature, or point at which 50% is unfolded
Tonset (for ratio)
Temperature at which unfolding begins
Ea (*parameter derived from data)
Activation energy of unfolding
Reversibility of unfolding
Point at which irreversibility happens when unfolding
Binding
THERMAL SHIFT
Tm-diff (for 330 nm, 350 nm, and ratio)
Difference of melting temperatures Tm between ligand-bound and apo-state of proteins
EC50 (for 330 nm, 350 nm, and ratio)
Concentration-dependence of Tm-diff
Backreflection
AGGREGATION
Tturbidity
Onset temperature of aggregation
Use nanoDSF for all kinds of applications
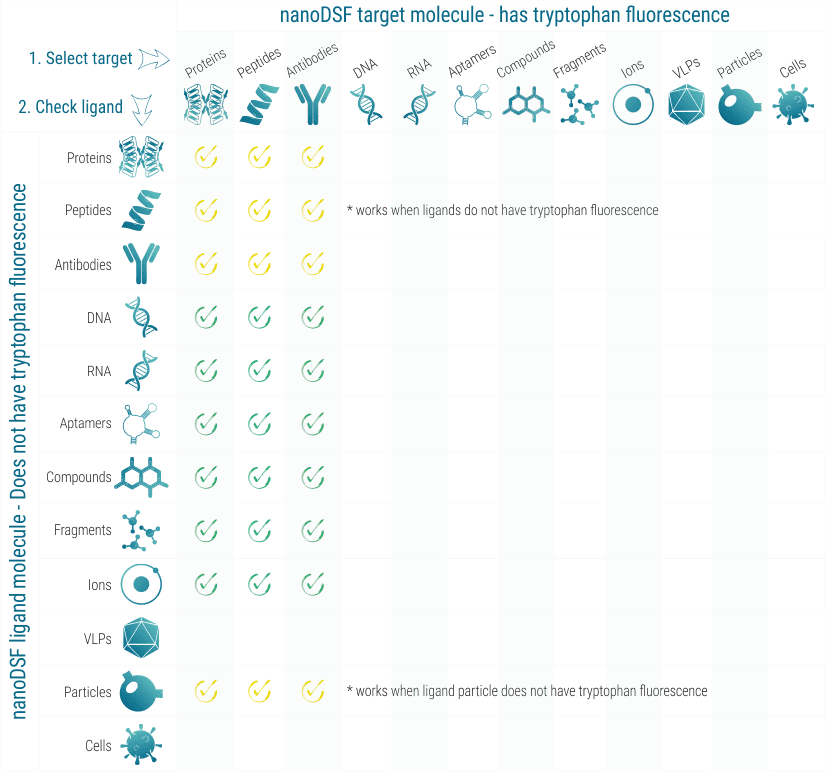
nanoDSF works with practically all proteins that show tryptophan fluorescence between 330 and 350 nm. In some cases, also high tyrosine fluorescence is sufficient. When the influence of a ligand molecule on the stability of the target molecule should be analyzed, the ligand molecule must not show fluorescence in the tryptophan region.
Protein stability
NanoDSF tells thermal and chemical stability of proteins (temperature or denaturant concentration where 50% protein is unfolded).
Protein Aggregation
nanoDSF will tell you the aggregation state of your protein at 25°C as well as the thermally induced aggregation stability (aggregation temperature).
Yes-No Binding
nanoDSF will tell you whether your target protein is stabilized or destabilized by a ligand molecule.
Effective concentrations
By titrating ligand molecules across a large concentration range, nanoDSF can also tell EC50 values.
- Formulation development
- Pre-formulation
- Buffer optimization
- Protein analysis
- Formulation development
- Pre-formulation
- Buffer optimization
- Protein analysis
- Ligand screening
- Drug discovery
- Protein stabilization
- Ligand screening
- Drug discovery
- Protein stabilization
Advantages of nanoDSF
Modification-free
– in-solution
– no immobilization
– no labeling
Highly efficient
– fast analysis
– high-throughput
– multiple parameters
Quality-controlled
Detection of sample aggregation and fluorescence effects
Highly variable
– Free choice of buffers
– Use bioliquids
– Serum, cell lysate
Very frugal
Complete stability profile with just microliters of sample
nanoDSF Technology
Overview
In general, the intrinsic tryptophan fluorescence of proteins is strongly dependent on their 3D-structure and hence the local surroundings of the tryptophan residues. Using chemical denaturants or a thermal gradient, proteins can be unfolded, which leads to changes in their intrinsic tryptophan fluorescence. This translates into fluorescence emission peak shifts and intensity changes. NanoDSF monitors these fluorescence changes with high time-resolution and can reveal even multiple unfolding transitions. NanoDSF is therefore highly successful in antibody engineering, membrane protein characterization, protein quality control, buffer screening, protein unfolding analysis, and small molecule compound binding screening.

The figure above illustrates the principle behind thermal protein unfolding: Increasing temperature causes unfolding of the three-dimensional protein structure and thus tryptophan residues to become solvent exposed. NanoDSF monitors the concurrent changes in tryptophan fluorenscence at 330 and 350 nm wavelength.
In order to detect protein aggregation, the special Prometheus NT.48 nanoDSF device available at 2bind features also back-reflection optics. Normally, visible light passes through the capillaries containing the protein sample of interest without any interference, is reflected by a mirror on the capillary tray, and finally quantified by the detector. If the protein sample contains aggregated particles, the incident light is scattered by these particles. The loss of reflection intensity is a precise measure for protein aggregation.
Technology

Up to 48 capillaries are filled with 10 µl of protein sample and simultaneously scanned at 330/350 nm wavelengths. Melting temperatures are recorded by monitoring changes in the intrinsic tryptophan fluorescence and aggregation onset temperatures are detected via back-reflection light scattering. The samples can be heated to any temperature in the range from 25°C to 95°C. Importantly, samples can be studied without the use of a dye and with free choice of buffer and detergent. Melting temperatures of proteins with a concentration between 5 µg/ml and 250 mg/ml can be analyzed. In order to obtain high quality aggregation onset temperatures, protein solutions with concentrations above 1 mg/ml are required.
Data interpretation
The interpretation of nanoDSF data can range from easy and straightforward to relatively complex, because the change in fluorescence if often a complex mixture of changes in fluorescence intensity at different wavelengthts as well as shifts of the underlying fluorescence spectra of the denatured protein in relation to the native state. To make life easier, below is a guid of the most common cases of nanoDSF data analysis and interpretation.
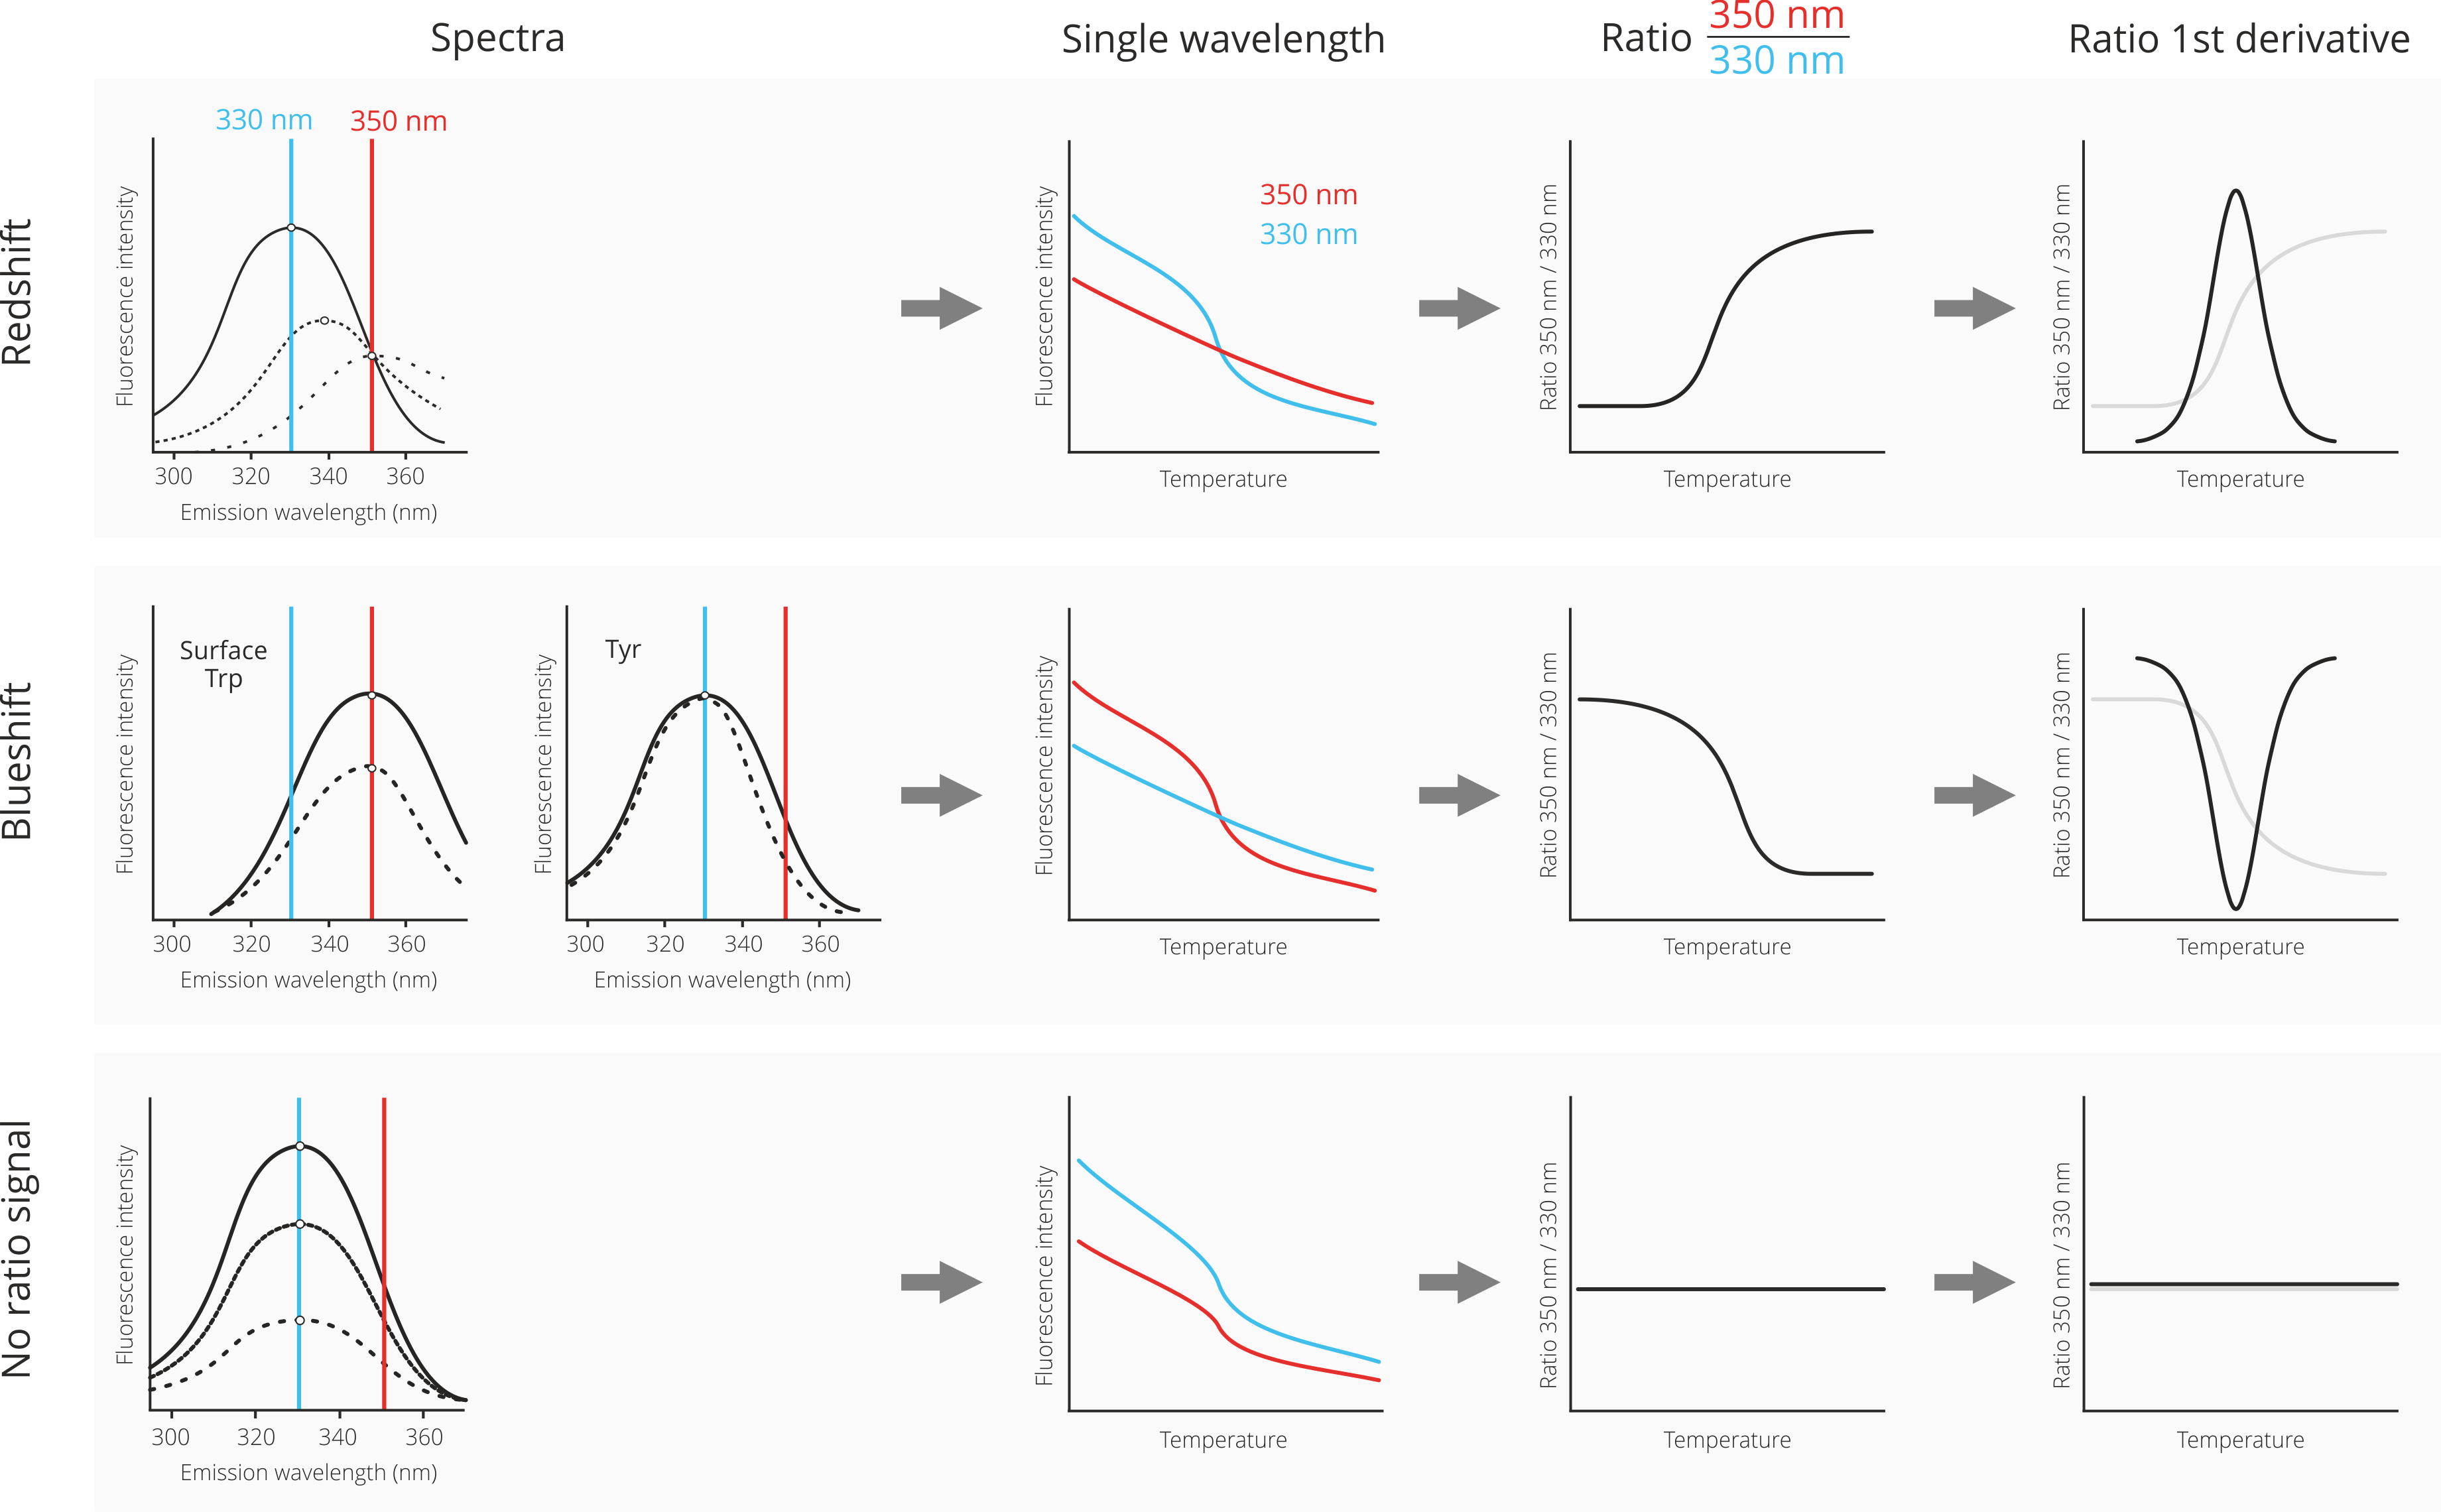
First, let us consider a case where the denaturated state shows a fluorescence spectrum that is red-shifted (dotted lines) in relation to the spectrum of the native state (solid line). A red-shift is the most common result of protein denaturation, because the tryptophan residues, which are usually packed inside the hydrophobic core of the protein are now exposed to the hydrophilic solvent environment. This leds to a change of their fluorescence properties towards higher wavelenghts. Please note that the Prometheus NT.48 nanoDSF device does not measure full fluorescence spectra, but only monitors at the two distinct wavelenghts 330 nm and 350 nm. The depicted spectra are only for visualization.
In the case of a red-shift upon protein unfolding, the fluorescence signal at 350 nm does not change too much; consequently the fluorescence intensity progression in the single-wavelength graph is rather linear. However, at 330 nm the fluorescence intensity changes quite drastically due to the red-shift; consequently, the fluorescence intensity decreases with increasing temperature. The division of the 350 nm signal by the 330 nm signal now leads to an inversion of the curve progression, because “no change” at 350 nm is divided by “decrease” at 330 nm, resulting in an increase of the ratio signal. Finally, the mathemal operation of 1st derivate transforms the ratio curve into a classical peak shape. The maximum of the peak corresponds to the melting temperature of the protein (inflection point of the underlying ratio curve).
Second, let us consider a case in which the denaturation of the protein leads to a blueshift. This can either be the case for a surface exposed tryptophan, which gets surrounded by hydrophobic residues in denatured “clumps” of protein. Alternatively, a blueshift is sometimes observed for interior tyrosine residues.
In the case of a blue-shift upon protein unfolding, the fluorescence signal does not change that much at 330 nm and changes more strongly at 350 nm. Consequently the fluorescence intensity curves look exactly opposite to the red-shift case: Now, there is not much change in the fluorescence intensity progression of the 350 nm signal, but a pronounced decrease of the 330 nm fluorescence intensity signal. The division of the 350 nm signal by the 330 nm signal results in a similarily oriented ratio curve, because a “decrease” at 350 nm is divided by “no change” at 330 nm. Finally, the mathemal operation of 1st derivate transforms the ratio curve into a classical peak shape. The maximum of the peak corresponds to the melting temperature of the protein (inflection point of the underlying ratio curve). Due to the decrease of the ratio curve, the peak is now inverted and facing downwards.
Third, and last, let us consider a case where there is neither a red-shift nor a blue-shift upon protein unfolding (or both effects cancel each other out). In such a case, only the overall fluorescence intensity decreases for both the 330 nm and the 350 nm channels. This translates into decreases in both fluorescence intensity curves in the single wavelength graph. Because there is now a decrease in both wavelenghts, the division of both signals leads to a rather flat ratio curve. Consequently, no meaningful 1st derivative curve can be calculated. In such a case, it is best practice to analyze the single wavelength graphs instead of the ratio curve for determination of the melting temperature.
Typical applications
- Screening of buffers, formulationd, and buffer additives
- Screening of detergents
- Analysis of thermal and chemical protein unfolding
- Long-term protein and antibody storage optimization
- Forced-degradation stability testing
- Comparison of biosimilar proteins and antibodies with respect to stability and aggregation
- Batch-to-batch comparison assays
- Deep feature analysis (influence of mutations, modifications, conjugations on protein stability and aggregation)
For more information, take a look at our Application Database as well as our services for Drug Discovery, Antibody Development, and Protein Biophysics.
Advantages
- Low sample consumption → Only 10 µL of sample required
- Free choice of assay buffers → Also biological liquids possible such as serum or cell lysate and other additives/detergents
- Very short analysis time → enables high throughput
- Optimal data quality and resolution → Dual 350/330 nm UV-detection
- Wide temperature range → Analysis possible from 15°C to 95°C
- No labeling required → Close-to-native analysis possible
- Wide concentration range → 5 µg/ml to 200 mg/ml
- Wide molecule size range → From 1 kDa to 1 MDa
Frequently asked questions
FAQ – General
What are typical applications for the nanoDSF Technology? Is screening possible?
Furthermore the nanoDSF technology is especially suited for applications in antibody engineering since the ultra-high resolution allows to detect and to analyze multiple unfolding transitions and unfolding events. NanoDSF also provides the possibility to measure the stability of membrane proteins in detergents since this method is truly label-free and does not require any fluorescent dye.
Moreover, due to the fast analysis pace and high throughput, nanoDSF is well suited for screening of buffers, buffer additives or small molecule influence on protein stability and protein unfolding.
How many tryptophans are needed for detection?
How many samples can be measured in parallel?
Is it possible to detect wavelength shifts due to protein unfolding?
Are fluorescent dyes required for nanoDSF analysis?
Another label-free method based on tryptophan fluorescence is label-free MicroScale Thermophoresis. This technique allows for measuring steady-state binding affinities of molecular interactions.